EWARNS is part of the surveillance system and is activated during emergencies. The main objective of EWARNS is to rapidly detect and respond to signals that might indicate outbreaks and clusters of epidemic-prone diseases.
The system has two components: an immediate alert component (for early verification and investigation); and a weekly reporting component (for monitoring trends of an event).
EWARNS was established in Iraq in November 2013 after the massive displacement of Syrian refugees to the northern region of the country. In 2014, EWARNS was extended to include all health facilities serving displaced populations in all governorates of Iraq.
e-EWARNS was developed in early 2015. A health facility enters data by electronic device, which is then received immediately by relevant people at governorate and central levels. Data analysis is performed at central level to monitor trends and identify any abnormal increases in a disease event. In addition, weekly bulletins are prepared centrally by the WHO EWARNS team and distributed to relevant people. There is an e-mail network for immediate alerts. When an alert is triggered, an e-mail is received by the responsible person at governorate or national level within 24 hours. The immediate reporting, verification and outbreak investigation of alerts is conducted by the governorate’s department of health, WHO and other partners.
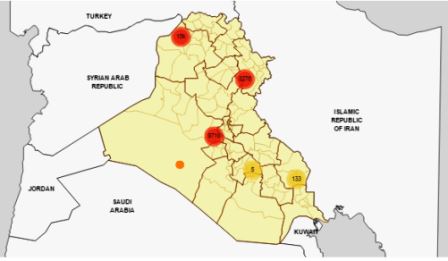
This EWARNS dashboard allows users to access the data of a particular EWARN reporting health facilities by week. Moving the cursor on the map will allow access to data by health facility and governorate by week. In addition, a page includes descriptive analysis data of each health facility by week of onset. This page shows a summary analysis of the events and the calculation of the expected reporting disease event for the next week. If the real trend crosses the estimated line that may indicate a real alert of abnormal increase, which will need verification from the local authority. There is a simple graph that includes 2 lines in the lower part of the page (created by first selecting a health facility from the above box, and then selecting one of the events from a box below that will appear). The graph includes 2 lines (one shows the exact number of reporting disease and the second shows the estimated number). To monitor the trend of the disease you have to compare these 2 lines. Usually, during a normal situation, the real line has to be below the estimated one, but if crossed it means there is abnormal increase for verification.
The development of this dashboard has been funded by the European Commission's Humanitarian Aid and Civil Protection and the United States Agency for International Development Office of U.S. Foreign Disaster Assistance.
Related links
European Commission's Humanitarian Aid and Civil Protection
United States Agency for International Development's Office of U.S. Foreign Disaster Assistance


