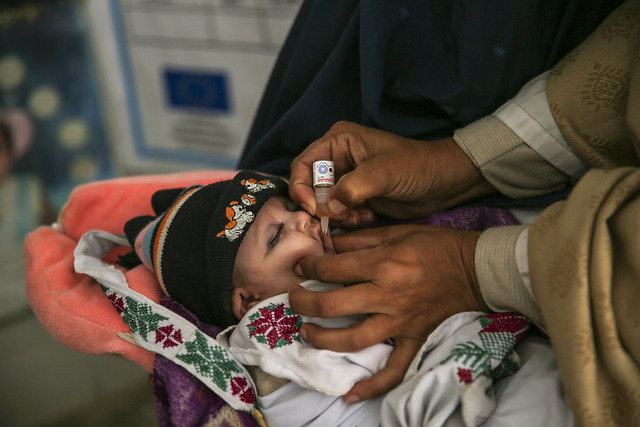
 Majra Bibi gives polio drops to 10-day-old Bilal Khan at a health unit in Khyber Pakhtunkhwa province, Pakistan. The polio programme works to vaccinate every child and detect the poliovirus wherever it remains. ©WHO/Asad Zaidi
12 November 2019 -- In a rapidly expanding megacity, amongst conflict or in mountainous border areas, how does the polio programme deduce where the virus is hiding?
To eradicate the poliovirus, every child must be vaccinated. We must also detect where virus remains. The two key methods used to do this are acute flaccid paralysis (AFP) surveillance, which alerts the programme to children exhibiting the key sign and symptom of polio, and environmental surveillance, which is used to detect the poliovirus in the sewage water systems of communities. But the most skilled disease surveillance officers can go one step further.
By cross referencing AFP and environmental surveillance data with data on immunization activities, population movements and high-risk populations, surveillance officers can learn to interpret the poliovirus risk in the countries where they work. Through painstakingly piecing these clues together, they can determine where there may be a high chance of polio re-appearing.
Disease surveillance officers and data managers from across the Eastern Mediterranean Region came together across a series of workshops held in September and October 2019, to learn how to use QGIS mapping software to record the clues that help the polio programme determine where the virus could circulate. Representatives attended from many member states in the region, three levels of the World Health Organization (WHO), and from CDC STOP, the Eastern Mediterranean Public Health Network, the VPI WHO EMR team, and the UNICEF MENA Regional Office.
 GIS and Mapping expert Ravi Santhana Gopala Krishnan presents aspects of QGIS to meeting participants. ©WHO/EMRO
QGIS is a powerful open-source Geographic Information System that supports editing, storing, analysing and displaying diverse geospatial data. The workshop taught the officers to use QGIS and mapping services in addition to other risk assessment tools to provide decision makers with a clear picture of country surveillance indicators, AFP cases, the geographical reach of routine and supplementary immunization activities, and data on accessibility and the movement of high-risk populations.
Information can be layered in QGIS to create a highly detailed virtual map with key indicators and risks for disease spread. For instance, it would allow programme officers to spot a high-risk area where there is a low level of AFP reporting, where there is high population movement, and where few vaccination campaigns have been carried out and children have low immunity to the virus.
In other words, the maps allow real time analysis of outbreak risk. This information can then be used to strategize upcoming supplementary immunization campaigns and technical surge support or make recommendations to improve programme performance.
QGIS is free, works on mobile phones, and does not require a license, making it ideal for use in resource-poor contexts where the expensive licenses required for other GIS applications are not a viable option for some users.
The workshop ultimately aimed to empower surveillance officers and data managers to create maps that will help them to spot areas of concern and develop mitigation strategies. They learnt how to overcome common challenges, for instance, how to reconcile data sets created in different programmes, and how to treat data that arrives without a dedicated GPS coordinate.
This training is just one strategy to improve our ability to prevent outbreaks and stay ahead of the virus, in some of the most challenging epidemiological contexts in the world.
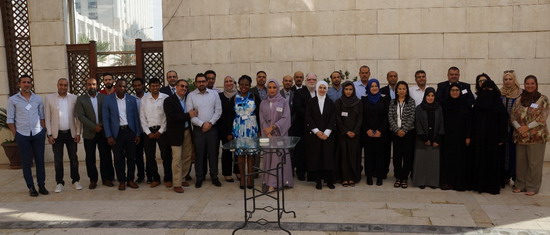
 Participants at the first QGIS training, held in September 2019. ©WHO/EMRO
 Participants at the second QGIS training, held in October 2019. ©WHO/EMRO


