Research article
H.N. Sadek 1 and N.A.H. Ajeel 2
معدلات الوفيات المعيّرة بالعمر بحسب سبب الوفاة في البصرة، العراق: 1978 و2007
حسام ناطق صادق، نرجس عبد الحسن عجيل
الخلاصة: إن معطيات الوفيات ضرورية لتحديد ما تمثله مختلف الأمراض من أهمية للصحة العمومية، ولتخصيص الموارد على نحو مناسب. وقد أجريت هذه الدراسة الوصفية للتعرف على نمط الوفيات في محافظة البصرة في جنوبي العراق باستخدام سجلات الوفيات في نظام السجل المدني للعامين (1978 و 2007). وكان إجمالي معدل الوفيات المعيّر بالعمر أقل في عام 2007 عنه في عام 1978 (7.95 مقابل 8.70 لكل ألف شخص)، وكذلك كانت معدلات الوفيات الخاصة بعمر معين، باستثناء تلك المعدلات لصغار البالغين، والتي كانت أعلى بنسبة %22. وكان السبب الرئيسي للوفاة في كلا العامين هو الأمراض القلبية الوعائية، أما السرطان الذي كان ثالث سبب رئيسي في عام 1978 فقد احتل المرتبة الثانية في عام 2007. وانخفضت معدلات الوفيات بنحو %45.5 للأمراض المعدية في عام 2007 مقارنة بعام 1978، وبنحو %39.5 للأمراض التنفسية، وبنحو %50.0 لأمراض الجهاز الهضمي، ولكنها ارتفعت بحوالي %66.7 للتشوهات الخلقية، وبأربعة أضعاف لأمراض الغدد الصماء وأمراض التغذية.
ABSTRACT Mortality data are essential to identify the public health importance of different diseases and allocate resources appropriately. This descriptive study was carried out to assess the pattern of mortality in Basra governorate in southern Iraq using the death records from the civil registry system for 2 years (1978 and 2007). The overall age-standardized mortality rate was lower in 2007 than 1978 (7.95 versus 8.70 per 1000), so too were the age-specific mortality rates, with the exception of that for young adults, which was 22% higher. The leading cause of death in both years was cardiovascular diseases, while cancer was the third leading cause in 1978 and the second in 2007. Mortality rates were 45.5% lower for infectious diseases in 2007 compared with 1978, 39.5% lower for respiratory diseases, 50.0% lower for digestive system diseases, 66.7% higher for congenital malformations and 4-fold higher for endocrine and nutritional diseases.
Taux de mortalité par cause normalisé selon l'âge à Bassora (Iraq) : 1978 et 2007
RÉSUMÉ Les données sur la mortalité sont essentielles pour identifier l'importance des différentes maladies en santé publique et allouer des ressources de manière appropriée. La présente étude descriptive a été menée pour étudier les caractéristiques de la mortalité dans le gouvernorat de Bassora (sud de l'Iraq), en utilisant les actes de décès des registres d'état civil sur deux années (1978 et 2007). Le taux de mortalité global normalisé selon l'âge était inférieur en 2007 à celui de 1978 (7,95 par rapport à 8,70 pour 1000). Il en est de même pour les taux de mortalité spécifiques normalisés selon l'âge, à l'exception du taux pour les jeunes adultes, qui avait augmenté de 22 %. Les maladies cardio-vasculaires étaient la principale cause de décès pour les deux années et le cancer, la troisième principale cause en 1978, était devenu la deuxième cause en 2007. Par rapport à 1978, Les taux de mortalité en 2007 étaient inférieurs de 45,5 % pour les maladies infectieuses, de 39,5 % pour les maladies respiratoires, de 50,0 % pour les maladies du système digestif, mais supérieurs de 66,7 % pour les malformations congénitales et quatre fois plus élevés pour les maladies endocriniennes et nutritionnelles.
1Basra Directorate General of Health, Basra, Iraq.
2Department of Community Medicine, College of Medicine, University of Basra, Basra, Iraq (Correspondence to N.A.H. Ajeel:
Received: 03/04/11; accepted: 20/11/11
EMHJ, 2012, 18(10): 1049-1054
Introduction
Mortality data are essential for health planners to identify the public health importance of different diseases, allocate resources for their control and evaluate the impact of ongoing health interventions [1]. No single set of measures can completely characterize the health of a large and diverse population. However, it has been suggested that mortality data along with life expectancy are the best indicators of overall population health because they represent the cumulative effects of social and physical environmental factors, behavioural and genetic risk factors, and the level and quality of health care [2]. Furthermore it is well known that infant mortality is the most useful measure of health status because it indicates both the current health status of the population and predicts the health of the next generation [2]. It reflects the overall status of maternal health as well as the quality and accessibility of primary health care available to pregnant women and infants [2].
The present study was carried out to compare the rates and major causes of mortality in Basra governorate, Iraq, for both sexes and for different age groups, in 1978 and 2007.
Methods
This study was an observational, descriptive study carried out in Basra governorate, Iraq. All deaths registered in Basra governorate during the years 1978 and 2007 were included.
Source of data
The source of data was the records of deaths in the 15 registry offices of Basra governorate. The offices were visited and used for data collection over a period of 7 months from 6 May to 14 December 2008. For each death in the years 1978 and 2007, the following variables were extracted: age at time of death, sex and cause of death. Causes of death were classified according to the International statistical classification of diseases and related health problems, 10th revision (ICD-10) [3]. Codes were added to the underlying cause of death for both years by the researchers. The underlying cause of death was defined as “the disease or injury which initiated the train of morbid events leading directly to death, or the circumstances of the accident or violence which produced the fatal injury” in accordance with the ICD-10 guidelines [4].
Coding
Causes of deaths were classified into the main categories of the ICD-10: infectious diseases (codes A00–B99), neoplasms (codes C00-D48), diseases of the blood (codes D50–D89), endocrine and nutritional diseases (codes E00–E90), mental and behavioural disorders (codes F00-F99), diseases of the nervous system (codes G00–G99), diseases of the eye (codes H00–H59), diseases of the ear (codes H60–H95), diseases of the circulatory system (codes I00–I99), diseases of the respiratory system (codes J00–J99), diseases of the digestive system (codes K00–K93), diseases of the skin (codes L00–L99), diseases of the musculoskeletal system and connective tissue (codes M00-M99), diseases of the genitourinary system (codes N00–N99), maternal conditions (codes O00–O99), certain conditions originating in the perinatal period (codes P00–P96), congenital malformations (codes Q00–Q99), symptoms and signs not elsewhere classified (codes R00–R99) and external causes of mortality (codes S00–S99) [3]. The main categories, not the detailed codes for the specific diseases, were chosen because the use of too much detail hinders obtaining a panoramic view of the health situation and the most relevant problems [5]. Causes of death were assigned by medically qualified staff in both years to assure the quality of diagnosis of cause of death. The percentage of ill-defined causes (symptoms and signs not elsewhere classified) was between 10% to 20% for different districts, for both years. According to World Health Organization (WHO) criteria, the level of data quality was medium [4].
Analysis
Data were input to the computer and analysed using SPSS, version 11. Calculation of different mortality rates (age-specific and cause-specific rates) for the years 1978 and 2007 were based on number of deaths in each category in specific year/midyear population related to that category in that year × 1000 [6]. Proportionate mortality was based on the number of deaths from a specific cause in a specific year/total deaths in that year ×100 [6]. While the age-standardized mortality rate is a weighted average of the age-specific mortality rates per 100 000 persons, the weights are the proportions of persons in the corresponding age groups of the WHO standard population [7]. This rate was used to eliminate the effect of changes in the age structure of Basra population in the 2 studied years and to allow comparison with neighbouring populations [6]. Information related to the population of Basra was based on estimates for the years 1978 and 2007, mainly derived from the Iraqi Ministry of Health and the Statistical Office in Basra. However, the age structure for each sex separately was not available for the year 1978, so we could not calculate the age-standardized rates for each sex for 1978.
Results
The age-standardized mortality rates for the 2 studied years (1978 and 2007) are shown in Table 1. In 2007 the overall mortality rate in Basra was 8.6% lower than in 1978. In both years, the age-specific mortality rates rose with age, with the highest rates among the elderly (65 years or older). Death rates in 2007 in every age group were lower than the corresponding rates in 1978, with the exception of the rate for young adults (15–44 years) which was about 22% higher in 1978 (167/100 000) than in 2007 (203/100 000) (Table 2).
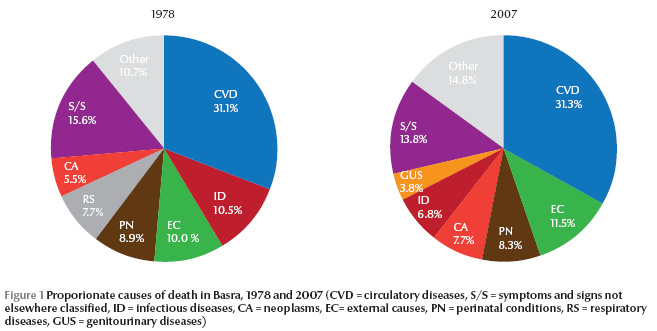
According to the proportionate mortality, causes of death for the years 1978 and 2007 were similar, with high rates of death due to circulatory system diseases, external causes, perinatal conditions, infectious diseases and neoplasms. The most important differences between the 2 study years, however, were the contributions of neoplasms and infectious diseases to the total deaths (Figure 1).
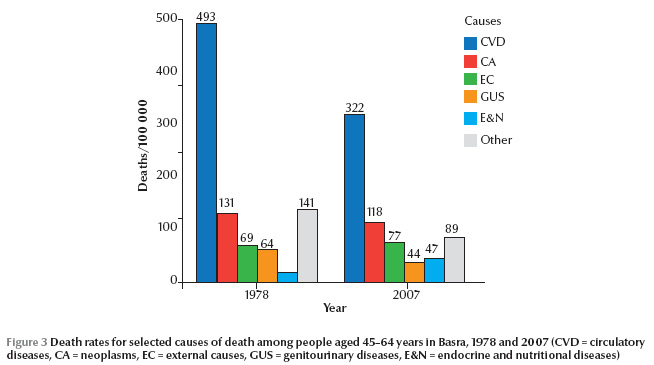
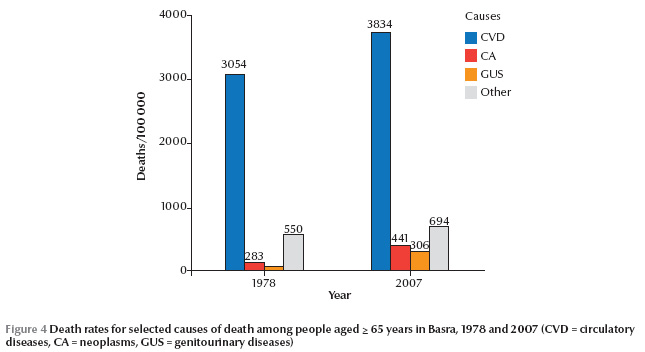
According to the age-adjusted mortality rates of 9 major causes of death for the years 1978 and 2007 the leading cause of death among the Basra population in both years was cardiovascular diseases. The age-adjusted death rate for these diseases in 2007 was 6% higher than the rate in 1978 (Table 3). In 1978, cardiovascular diseases were the leading cause of death for people aged 45–64 years, as they were for the older age group (≥ 65 years) and they were the second leading cause in young adults (15–44 years). In 2007 the circulatory system diseases death rate for the elderly population (3834 per 100 000 population) was 25.5% higher than the death rate for those in the same age group in 1978 (Figure 2 , Figure 3 and Figure 4).
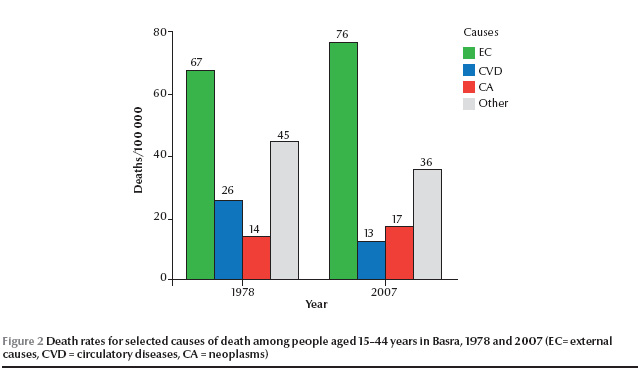
External causes were the second leading cause of death in 1978 and the third cause of death in 2007. The death rate in 2007 for this cause was nearly 5% lower than the rate in 1978. However, external causes of death accounted for 11.5% of the total deaths in 2007 compared with 10% in 1978 (Figure 1). Furthermore, the death rate due to external causes was the leading cause of death for young adults aged 15–44 years in both years and the rate was 13.4% higher in 2007 than 1978 (Figure 2).
Cancer was the third leading cause of death in 1978 and the second in 2007. The age-adjusted death rate for cancer was 20.3% higher in 2007 than in 1978 (Table 3). In 2007, cancer was the second leading cause of death in all age groups over 15 years of age (Figures 2, 3 and 4). Other striking differences were a 45.5% lower rate of deaths due to infectious diseases in 2007 versus 1978, 39.5% lower for respiratory diseases, 50% lower for digestive system diseases, 66.7% higher for congenital malformations and nearly 4-fold higher for endocrine and nutritional diseases (Table 3).
Discussion
Mortality data are required to study trends in causes of mortality and the socioeconomic, demographic and lifestyle risk factors associated with them [1]. Mortality data can be obtained either from civil registration records or from surveys, but according to WHO the civil registration systems are the most reliable source of statistics on births, deaths and causes of death [8].
Unfortunately, practical errors in death certification are common, even in countries with a high level of data quality, and range from incomplete certificates to inaccurate causes and manners of death [9]. Globally, two-thirds of annual deaths are not registered, and every year, almost 40% of global births go unregistered [8]. However, Iraq has the necessary law (since 1971) and infrastructure (in Basra 15 registry offices distributed throughout the province) to make it obligatory to register births and deaths. Therefore, the health authorities in Iraq have a strict control system for death registrations so that every single verified death certificate can be followed. Theoretically then the completeness and coverage of death registrations in Basra are approximately 100%. While some deaths, especially of neonates, may go unregistered, this is likely to be very marginal.
Age, sex and place of death are mostly accurate, if present, but the main problem of death certificate information is the cause of death. Accuracy in diagnosing causes of death still varies from one country to another [10]. In a study carried out in an academic institution in the United States in 2002–03, 34% of the death certificates had the wrong diagnosis for cause of death [9]. Furthermore, the selection of a single underlying cause of death is frequently problematic, especially in elderly people, who often have had several chronic diseases that concurrently lead to death. Studies have shown that even in countries where causes are assigned by medically qualified staff, there is often substantial use of ill-defined codes for cause of death [10]. However, despite all the problems with the civil registration systems, they are still the most reliable source of statistics on deaths and causes of death [8].
In Basra the overall mortality rate and the age-specific mortality rates were lower in 2007 compared with 1978, with the exception of that for young adults, which was 22% higher. This higher rate of young adult deaths may be mainly attributed to the current violent events taking place in Iraq since 2003, in which the victims were mainly young adults, particularly males.
In 2007 cardiovascular disease was the leading cause of death among the Basra population. It was the leading cause of death among persons 45 years of age and older and the third leading cause among young adults (15–44 years of age), after external causes and cancer. Furthermore, mortality rates due to cancer were also higher both in relative and absolute terms. In 2007, cancer was the second leading cause of death for persons 15 years of age and over. In contrast, mortality due infectious diseases was lower overall in 2007. Economic development is commonly associated with a transition from infectious to noncommunicable diseases. The present study showed some evidence of a health transition with high chronic diseases and low infectious diseases mortality rates in 2007 than 1978. This was more evident when the rates are age-standardized, showing that the first 2 leading causes of death were cardiovascular diseases and cancer. The results of the study also indicate both relative and absolute higher rates of deaths due to endocrine and nutritional diseases and congenital malformations in 2007 versus 1978. The higher rate of congenital malformation deaths could reflect a real increase in both incidence and death due to these conditions and/or better diagnosis and registration.
Comparison of the results of the present study with those for the neighbouring countries (especially Kuwait and Syrian Arab Republic), suggests that these countries have the same pattern of deaths, particularly the age-specific deaths in which the concentration of deaths is in old and middle-aged people [11]. The major causes of death in Basra for both the general population and for different age groups were also similar in surrounding countries [12]. In addition, a study had drawn attention to the significant contribution of congenital malformations to perinatal deaths in the Eastern Mediterranean Region [13]. On the other hand, the pattern of mortality in Basra is similar to that for the developed countries with respect to the major causes of death being circulatory system diseases and neoplasms [11].
In conclusion, chronic diseases (cardiovascular diseases and cancer) were the leading causes of death in Basra in 2007. These diseases may require a different approach to prevention, detection, and treatment compared with the infectious and acute illnesses more common in the past.
References
- Healthy people 2010: Understanding and improving health, 2nd ed. Washington DC, United States Department of Health and Human Services, 2000.
- Chapter 5. Human exposure and health. In: EPA’s report on the environment.. Washington DC, United States Environmental Protection Agency. 2008:31–33.
- International statistical classification of diseases and related health, 10th revision. Geneva, World Health Organization, 1990.
- About the WHO mortality data. World Health Organization [online] (http://www.who.int/healthinfo/statistics/mortdata/en/index.html, accessed 13 August 2012).
- Becker R et al. A method for deriving leading causes of death. Bulletin of the World Health Organization, 2006, 84:297–304.
- Gordis L. Epidemiology. Philadelphia, Saunders, 1996:41.
- Age-standardized mortality rates by cause (per 100 000 population). World Health Organization [online] (http://www.who.int/whosis/whostat2006AgeStandardizedDeathRates.pdf, accessed 28 August 2012).
- Civil registration: why counting births and deaths is important. Fact sheet No. 324. World Health Organization [online] (http://www.who.int/mediacentre/factsheets/fs324/en/index.html, accessed 13 August 2012).
- Pritt BS et al. Death certification errors at an academic institution. Archives of Pathology & Laboratory Medicine, 2005, 129:1476–1479.
- Mathers CD et al. Counting the dead and what they died from: an assessment of the global status of cause of death data. Bulletin of the World Health Organization, 2005, 83:171–177.
- World health statistics report 2006. Geneva, World Health Organization, 2007:22–29.
- Abu-Rashid N, Al-Jirf S, Bashour H. Causes of death among Syrian children using verbal autopsy. Eastern Mediterranean Health Journal, 1996, 2:440–448.
- Hamamy H, Alwan A. Hereditary disorders in the Eastern Mediterranean Region. Bulletin of the World Health Organization, 1994, 72:145–154.
