Research article
W. Akhtar,1 A. Ali, 2 M.A. Arain,2 F. Saeed,3 S. Siddiqui 1 and A. Memon 1
المقاييس البيولوجية بالتخطيط بالأمواج فوق الصوتية لأترابيَّة من الباكستانيين
وسيم أختر، عارف علي، مبشر أسلم عرين، فرج سعيد، سلمان صديقي، إعجاز ميمن
الخلاصة: تهدف هذه الدراسة إلى إعداد الشرائح المئوية للنمو في مختلف أسابيع العمر الجنيني لكل من القطر بين الجداريين، والمحيط البطني، وطول عظم الفخذ، ومحيط الرأس في أترابيَّة من الباكستانيين. وقد تمَّ جمع المعطيات في مستشفى ثالثي للإحالة من نساء حوامل تتراوح أعمارهن الحملية بين 13 و40 أسبوعاً، وتـمَّت إحالتهن لإجراء تخطيط بالأمواج فوق الصوتية كجزء من الرعاية الروتينية السابقة للولادة. وتمّ جمع إجمالي المقاييس البيولوجية للأجنة بالتخطيط بالأمواج الصوتية لـ 1599 جنيناً، وذلك بعد التحري عن معايير الإدراج في الدراسة. واشتُقَّتْ لكل قياس، نماذج تحوُّفيَّة منفصلة لتقدير المتوسط، والانحراف المعياري، والشرائح المئوية المرجعيَّة لكل أسبوع من العمر الجنيني لهذه الأترابيَّة. واختير أفضل نموذج مناسب لكل متغير. وسوف تساعد هذه المخططات اختصاصي الأشعة والأطباء في التنبؤ بتواريخ الولادة، وقياس نمو الجنين، وتحديد القصور الجنيني في السكان الباكستانيين.
ABSTRACT This study aimed to develop growth centiles at different gestational weeks for fetal biparietal diameter, abdominal circumference, femur length and head circumference in a Pakistani cohort. Data were collected at a tertiary referral hospital from pregnant women at gestational ages 13–40 weeks referred for obstetric ultrasound as a part of routine antenatal care. A total of 1599 fetal sonographic biometric measurements were collected after screening for the inclusion criteria. For each measurement, separate regression models were derived to estimate the mean, standard deviation and reference percentiles at each week of gestational age for this cohort. The best fitting model for each variable was selected. These charts will help radiologists and clinicians in predicting dates of delivery, assessing fetal growth and identifying intrauterine fetal insufficiency in the Pakistani population.
Tableaux de la biométrie fœtale à l’échographie d’une cohorte pakistanaise
RÉSUMÉ La présente étude visait à élaborer des tableaux de croissance de fœtus d’une cohorte pakistanaise aux différentes semaines de gestation et pour différentes mesures : le diamètre bipariétal, le périmètre abdominal, la longueur du fémur et le périmètre crânien. Les données ont été recueillies dans un hôpital de recours délivrant des soins tertiaires, auprès de femmes enceintes de 13 à 40 semaines et bénéficiant d’une échographie obstétricale dans le cadre des soins prénatals systématiques. Au total, 1599 mesures biométriques fœtales ont été recueillies après une sélection fondée sur des critères d’inclusion. Pour chaque mesure, des modèles de régression distincts ont été élaborés pour obtenir une estimation de la moyenne, de l’écart type et des mesures de référence par centile pour chaque semaine gestationnelle. Pour chaque variable, le modèle le plus adapté a été retenu. Ces tableaux permettront aux radiologues et aux cliniciens d’estimer les dates d’accouchement des femmes pakistanaises, d’évaluer la croissance du fœtus ou de dépister un retard de croissance intra-utérin.
1Department of Radiology; 3Department of Obstetrics and Gynaecology, Aga Khan University Hospital, Karachi, Pakistan (Correspondence to W. Akhtar:
2Department of Research, Dow University of Health Sciences, Karachi, Pakistan.
Received: 25/01/10; accepted: 01/06/10
EMHJ, 2011, 17(12): 969-975
Introduction
Fetal biometric measurements of different anatomical structures are valuable in radiological and obstetric practice for the estimation of gestational age, assessment of intrauterine growth and differentiation of normal from abnormal fetuses [1]. Birth weight estimation also depends on different fetal biometric measurements and has tremendous value for neonatal management in terms of appropriate time of delivery, specific obstetric interventions and delivery under intensive neonatal care support. Clinical approaches to fetal biometric measurements and weight estimations by fundal height measurement and abdominal palpation are helpful, but are subjective and are strongly influenced by factors such as maternal obesity, multiple gestation and operator experience [2,3]. Additionally these approaches are non-technical and cannot be used reliably in the early stages of pregnancy.
At present ultrasound is the most widely accepted method for determining fetal anthropometric measurements [4,5] and many studies have emphasized its usefulness [6–10]. While growth measurement centiles have been generated by various investigators using standard parameters [11–16], almost all fetal biometric growth centiles using sonographic anthropometric measurements have been derived from data from European and American populations [11–15,17]; only a few studies have used Asian women [16,18]. Fetal anthropometric data from the population in Pakistan are limited [18] and fetal centiles derived from other ethnic populations applied in our locality might lead to systematic errors in estimation. The primary objective of this study therefore was to use fetal anthropometric measurements obtained from ultrasound from a multiethnic cohort of Pakistani low-risk pregnant women to establish growth centile charts for our local population.
Methods
Setting and sample
Data were collected from 1 January 2007 to 31 July 2008 in the department of radiology of Aga Khan University hospital, Karachi. This is one of the largest tertiary care centres in the Pakistan, with patients coming from all ethnic strata within the country.
All pregnant women referred to the department of radiology for routine obstetric ultrasound examination as a part of antenatal care were included in the study. The inclusion criteria were singleton pregnancy, Pakistani ethnicity and gestational age confirmed by first trimester ultrasound or patients’ last menstrual period (LMP). Exclusion criteria were the presence of any fetal congenital abnormalities on ultrasound, uncertain LMP, ultrasound and menstrual age differing more than 10 days, fetus with intrauterine growth retardation, mother with underlying chronic diseases or on medication that could affect fetal growth or mother unavailable for follow-up. All pregnancies were longitudinally followed from the medical records until the birth of the baby. Neonates born with low birth weight or having low Apgar scores were also excluded. Of 1200 pregnancies with radiological records available, 600 patients fulfilled the inclusion criteria. From these pregnancies, 1599 obstetric ultrasounds were obtained at different gestational ages of the fetus during the course of the pregnancies.
Data collection
All women included underwent at least 1 ultrasound examination in each second and third trimester to determine fetal biometric measurements. All ultrasounds were performed by qualified, experienced obstetric radiologists using the predefined, structured departmental protocol. All measurements were done with a realtime ultrasound scanner (Aloka SSD-650) using a 3.5 MHz curvilinear probe. Soft copies as well as hard copy images of fetal biometric measurements were taken for documentation. A proforma was used for data collection.
Biparietal diameter (BPD), femur length (FL), head circumference (HC) and abdominal circumference (AC) of the fetus were measured in a standardized way using the electronic callipers of the ultrasound machine. BPD was measured (leading edge to leading edge) at the transthalamic plane with visualization of the cavum septum pellucidum. FL was measured from the greater trochanter to the lateral condyle. AC was measured at the level of the umbilical vein by tracing the outline of the trunk on the screen of the ultrasound machine (circular or elliptical outline includes the fetal spine, umbilical vein and stomach). HC was measured by outlining the head on the screen in transverse image. Three measurements were made for each variable.
Each woman contributed at least one set of measurements and each sonographic fetal biometric measurement was included in the analysis independently, regardless of the number of ultrasounds in a single pregnancy.
Data analysis
Data were entered and analysed using SPSS, version 16.0. Reference ranges (90% range between 5th and 95th centiles) were constructed for each biometric parameter and displayed in graph form. Linear, quadratic and cubic regression models were fitted to estimate the relationship between fetal BPD, FL, HC and AC (in millimetres) and gestational age (in weeks). Pearson correlation coefficients (R2) were calculated for each parameter to assess the strength of association for the developed regression model. The best fitting model for each variable was selected. A value of P 0.99 was considered statistically significant.
Results
shows the frequency distribution of fetal biometic measurements at each gestational age that were input to the analysis.
The significant regression models (P-value 99%) developed in this study are summarized in Table 2. The cubic model showed a good fit for BPD and FL, while AC and HC were well correlated with the quadratic model.
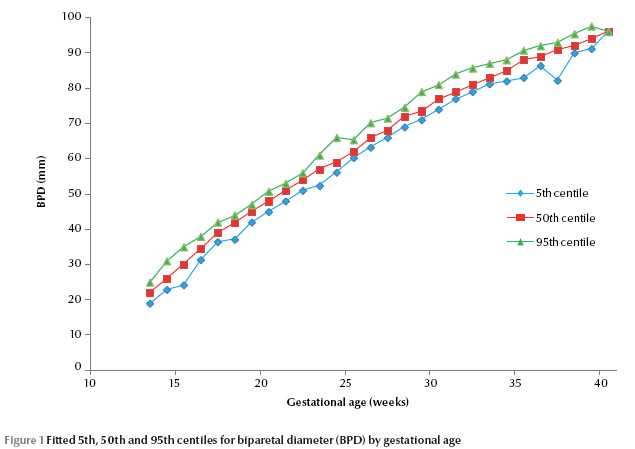
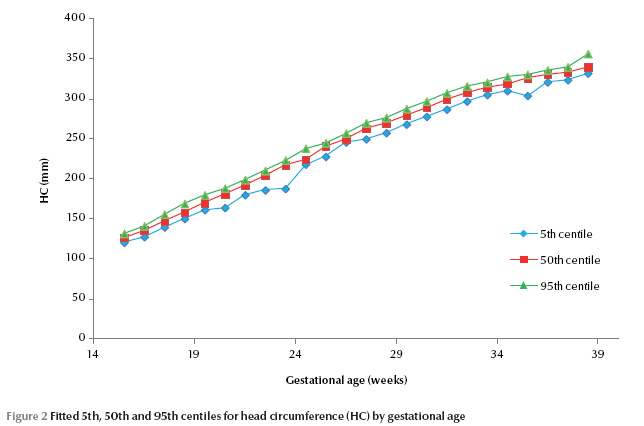
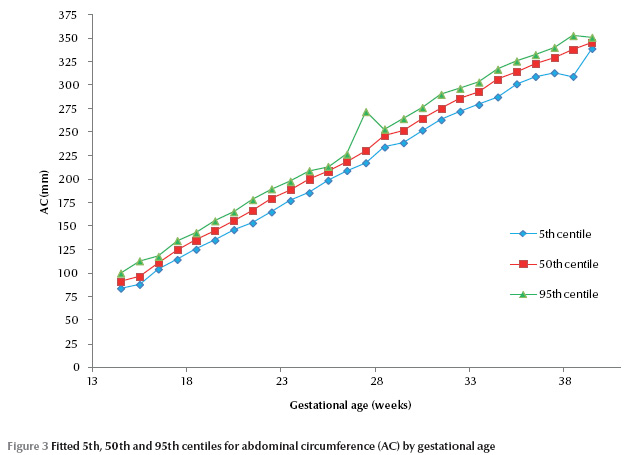
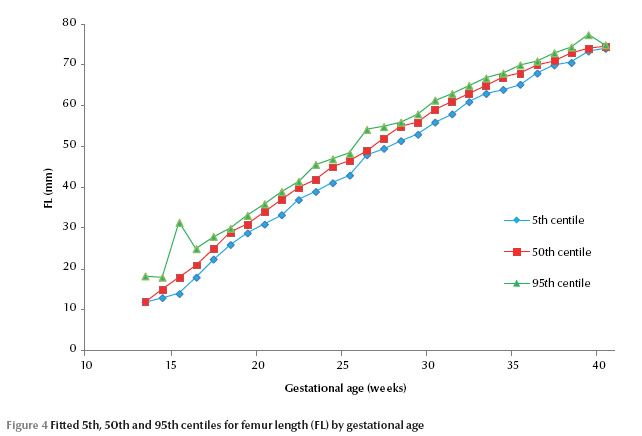
Figure (1) , Figure (2) , Figure (3) , Figure (4) show the estimated 5th, 50th and 95th centiles for BPD, HC, AC and FL respectively for each gestational week between 13th and 40th weeks of gestation. All the studied fetal biometric parameters showed linear growth with gestational weeks until the end of pregnancy. BPD and HC showed more rapid growth in the first half of pregnancy, while FL and AC showed faster growth rates in the later half of pregnancy. There was a peak of the 95th percentile at around 15th and 28th weeks gestation in AC and FL.


Discussion
In this study measurement ranges for fetal BPD, HC, AC and FL were derived from a multiethnic cohort of Pakistani low-risk pregnant women with singleton births. Each woman contributed at least one set of measurements. All studied fetal parameters showed linear growth with advancement in gestational weeks until the end of pregnancy; BPD and HC showed grew faster in the first half of pregnancy while FL and AC showed faater growth in later half of pregnancy.
The linear growth of BPD and HC until 34 weeks of pregnancy and the charts derived in this study for the 50th centiles of BPD and HC showed a close agreement with published charts from other countries and another Pakistani cohort [14,17,18].
Continuous linear growth of AC was seen from 16 weeks to the end of pregnancy. This finding and the 50th centiles derived for AC in this study were consistent with the charts of Lessoway et al. in a North American Caucasian population [17]. Abdominal size appeared to be larger than the 50th centile in Shahida et al.’s study in another cohort from Karachi, Pakistan [18]. This finding could be due to socioeconomic or ethnic differences between these 2 studies, as our study predominantly comprised patients of higher socioeconomic status, while Shahida et al.’s sample included a majority of patients from a particular ethnic group.
A linear growth of FL was seen until 36 weeks of pregnancy and then a plateau was identified; this was most likely due to transverse growth of the fetus at this stage rather than longitudinal growth. Charts derived in this study for the 50th centiles of FL showed close agreement with published charts from North Americans and Pakistanis [17,18].
The abrupt peak of the 95th percentile in AC and FL at around 15th and 28th weeks may be because of the wide standard deviation in measurements at these gestational weeks, probably because of the rapid growing period or perhaps due to random errors.
This study had some limitations, besides being carried out a single-centre, private institute site. The exact proportions of different ethnic groups within the sample could not be identified from the mother’s charts. Stratification of charts according to birth weight was not done and only normal birth weight babies were included. In addition, interobserver variability of fetal measurements was not assessed.
Nevertheless, we suggest that the fetal biometry charts derived in this study can be reliably used for the assessment of fetal growth in the local population. A large multicentre study is required to investigate possible differences in fetal growth across different ethnic groups in the Pakistani population.
Conclusion
Fetal BPD, FL, AC and HC centiles graphs for gestational weeks developed in this study are unique for thispopulation and can be used to assess fetal growth from ultrasound measurements.
References
- Hohler CW. Ultrasound estimation of gestational age. Clinical Obstetrics and Gynecology, 1984, 27:314–326.
- Shittu AS et al. Clinical versus sonographic estimation of fetal weight in southwest Nigeria. Journal of Health, Population, and Nutrition, 2007, 25:14–23.
- Balann DW, Prien SD. Estimation of fetal weight before and after amniotomy in laboring gravid woman. American Journal of Obstetrics and Gynecology, 2000, 55:229–239.
- Noumburg E et al. Prenatal ultrasound examination and risk of childhood leukemia: case control study. British Medical Journal, 2000, 320:280–283.
- Nyborg WL. Safety of medical diagnostic ultrasound. Seminars in Ultrasound, CT, and MRI, 2002, 23:377–386.
- Campbell S, Newman GB. Growth of fetal biparietal diameter during normal pregnancy. Journal of Obstetrics and Gynaecology of the British Commonwealth, 1971, 78:513–519.
- Shehzad K, Ali M, Zaidi S. Fetal biometry. Pakistan Journal of Medical Sciences, 2006, 22:503–508.
- Khalil H, Rana T, Goraya AR. Fetal weight prediction in 3rd trimester by ultrasonography. Annals of King Edward Medical College, 2002, 8:37–38.
- Parveen Z. Birth weight percentiles by gestational age: A hospital based study. Journal of Ayub Medical College, Abbottabad, 2001, 13:22–27.
- Campbell S. An improved method of fetal cephalometery by ultrasound. Journal of Obstetrics and Gynaecology of the British Commonwealth, 1968, 75:568–576.
- Altman GA, Chitty LS. Charts of fetal size. Methodology. British Journal of Obstetrics and Gynaecology, 1994, 101:29–34.
- Browne PC, Haminer LH, Scott Clark D. Sonographic fetal growth curves from an indigent population in Atlanta Georgia. Singleton pregnancies. American Journal of Perinatology, 1992, 9:469–476.
- Chitty LS et al. Charts of fetal size. Femur length. British Journal of Obstetrics and Gynaecology, 1994, 101:132–135.
- Chitty LS et al. Charts of fetal size. Head measurements. British Journal of Obstetrics and Gynaecology, 1994, 101:35–43.
- Snijders RJM, Nicolaids KH. Fetal biometry at 14–40 weeks gestation. Ultrasound in Obstetrics and Gynecology, 1994, 4:34–38.
- Ashrafunnessa et al. Construction of fetal charts for biparietal diameter, fetal abdominal circumference and femur length in Bangladeshi population. Bangladesh Medical Research Council Bulletin, 2003, 29(2):67–77.
- Lessoway VA et al. Ultrasound fetal biometry charts for a North American Caucasian population. Journal of Clinical Ultrasound, 1998, 26:433–453.
- 18. Zaidi S, Shahzad K, Omair A. Sonographic foetal measurements in a cohort of population of Karachi, Pakistan. Journal of the Pakistan Medical Association, 2009, 59:246–249.


