B.T. Shaikh,1 N. Mobeen,1 S.I. Azam1and F. Rabbani1,2
ABSTRACT A cross-sectional study of patient satisfaction with care was conducted over a period of 1 year from March 2004 to March 2005 in a secondary-level hospital in a peri-urban area of Karachi, Pakistan. Using the SERVQUAL tool and exit interviews, data were collected quarterly from a total of 1533 patients. Results sharing and capacity-building workshops were arranged during the 4 phases of the survey to sensitize the staff of the hospital to work towards improving patient satisfaction. The level of satisfaction of the patients with the outpatient health services provided showed a gradual increase from 34.4% to 82.0% over the 1-year period.
Utilisation de la mesure SERVQUAL aux fins de l’évaluation et de l’amélioration de la satisfaction des patients dans un établissement de santé rural au Pakistan
RÉSUMÉ Une étude transversale portant sur la satisfaction des patients en matière de soins a été réalisée sur une période d’un an, de mars 2004 à mars 2005, dans un hôpital de niveau secondaire d’une zone périurbaine de Karachi ( Pakistan). Grâce à l’outil SERVQUAL et aux entretiens de sortie, des données ont pu être recueillies chaque trimestre auprès de 1533 patients au total. Des ateliers destinés à la mise en commun des résultats et au renforcement des capacités ont été organisés pendant les quatre phases de l’étude afin de sensibiliser le personnel de l’hôpital et de l’encourager à améliorer la satisfaction des patients. Le niveau de satisfaction des patients vis-à-vis des services de soins externes dispensés est passé progressivement de 34,4 % à 82,0 % pendant la période d’un an.
1Department of Community Health Sciences, Aga Khan University, Karachi, Pakistan (Correspondence to B.T. Shaikh:
Received: 30/09/05; accepted: 05/02/06
EMHJ, 2008, 14(2): 447-456
Introduction
Quality in health is about care and caring. Quality of care can be defined as “the degree to which health services for individuals and populations increase the likelihood of desired health outcomes and are consistent with current professional knowledge” [1]. It has also been defined as “the totality of features and characteristics of a service that bear on its ability to satisfy a given need” [2]. Studies have found that the most important factors influencing patients’ choice of clinic are staff attitudes, the clinical environment, the services available and the operating hours [3,4].
The rising demand for assessment of quality can be attributed to rising costs of health care, constrained resources and evidence of variations in clinical practice [5]. The World Health Organization emphasized the importance of quality in the delivery of health care, as defined by the criteria of effectiveness, cost and social acceptability [6]. Other authors have stressed the need to assess “structural quality” or the availability of the health care structures and “process quality” through which care is delivered [7–9]. This assessment of quality is based on the application of professional standards that integrate measurement of patients’ views and their experiences [10]. The assessment of patient satisfaction represents a comparative balance between their perceptions of the service delivered and the expected standard they had set for the service [11]. Appraisal of patient satisfaction has been advocated as a reliable and inexpensive way to assess quality of services [12,13]. Giving importance to patient’s views in improving the quality of health services is to respect the sovereignty of the consumer and to democratize the process of care [14]. To evaluate patient satisfaction, researchers have used various approaches, such as evaluating the services during a specific time period, usually 6 months to 1 year, or by collecting data at the time of a specific medical care visit [15,16]. The latter approach was used in this study in Pakistan.
Study rationale
The average number of contacts with a health care provider for Pakistanis over the age of 5 years was 5.4 per year in 1998 [17]. Only 21% of the patients with an acute illness seek care at a public sector first-level health facility and a lack of quality care is one of the main reasons. In private hospitals and health care outlets, the quality of services is also compromised. A reliable system of information has always been missing in the health sector. These facts are sufficient to support the need to assess patient satisfaction with public and private health facilities in order to bring about an overall improvement in the quality of services delivered.
The present study was designed for the Health and Nutrition Development Society (HANDS), a Karachi-based nongovernmental organization, to explore aspects of quality of services and the level of patient satisfaction and to bring about an improvement in the delivery of outpatient services in its secondary health care facility in Jamkanda village of Bin Qasim town, Karachi. The hospital is run by HANDS as a public–private partnership with the local government.
Objectives of the study
The research question was whether a periodic surveillance of quality of care brings about improvement in patient satisfaction with health care services. The objectives were: to estimate periodically levels of patient satisfaction through the use of the SERVQUAL tool [18], assessing the quality of care; to sensitize the management of the facility and the health providers to the needs of their patients; and to demonstrate an improvement in patient satisfaction through the use of this tool.
Methods
This was a cross-sectional facility-based study over a period of 1 year, from March 2004 to March 2005. Exit interviews were conducted with patients every quarter. Built into the study was an intervention with the facility staff in each quarter, after each phase of data collection.
Sample
In the absence of available estimates on patient dissatisfaction with health services and with an estimated population of approximately 5000 attending outpatient services per quarter, we assumed a 50% prevalence of dissatisfaction, type 1 error of 5% and a bond on error of estimation to be 5%. The sample size was thus calculated to be 384 for each phase. This implies that for tracking patient satisfaction with services every quarter, at least 384 exit interviews should be conducted with clients. On the days of interviews, a total of 1533 outpatients who gave consent for interview were recruited.
Data collection
Patients were requested to participate in the interview when they came out of the hospital after a consultation with a health care provider. All patients who were resident in the catchment area of the hospital for the previous 6 months and were aged over 18 years at the time of interview were included. The respondents excluded were those who were seriously ill, staff members of the hospital and medico-legal cases.
After obtaining consent and explaining the purpose of the project, interviews were conducted. The interviewers had rigorous training on the questionnaire itself, interviewing skills and research ethics. The original English questionnaire was translated and administered in Urdu. The interview guidelines contained explicit explanations and phrasing of all the questions.
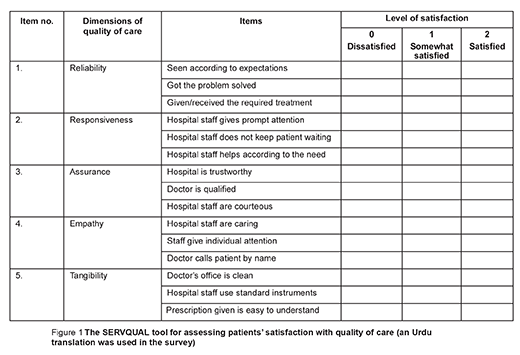
The SERVQUAL tool uses 5 dimensions to assess the quality of services: reliability, responsiveness, assurance, empathy and tangibility [18]. The aim of using this tool on a periodic basis is to assess the level of patient satisfaction with the services by tracking these dimensions of service quality. Therefore, the independent variables were the 5 dimensions of service quality as shown in Figure 1. Patient satisfaction was the dependent and outcome variable and would finally be graded as satisfied, somewhat satisfied and dissatisfied depending on the cumulative score obtained. Information on age, sex, education, occupation, income, and outdoor service used were also obtained.
Each of the 15 items listed under the 5 quality of care dimensions (reliability, responsiveness, assurance, empathy, tangibility) carried an equal weighting and were based on patient’s responses categorized as dissatisfied, somewhat satisfied and satisfied, scored 0, 1 and 2 respectively on a Likert scale of 0–2 (Figure 1). This method of providing a range of choices takes care of variability of responses and gives the respondent an opportunity to express the precise nature of his/her point of view [18]. The maximum possible score was 30 for a patient who rated all 15 items as satisfactory. For overall satisfaction, a cumulative score of 24 or above (80% or above) was considered as “satisfied”, 18–24 (60%–79%) as “somewhat satisfied” and below 18 (< 60%) as “dissatisfied” with quality of services. Through the use of this instrument each quarter, analysis would show variations in the satisfaction level. This analysis is simple and easy and can be done by facility staff to monitor quality of care on a regular basis and facilitate planning.

Data analysis
The quality of data was ensured through field editing by the interviewers and random audit of 5% of forms by the study coordinator. Data were double entered, checked for consistency and cleaned in Epidata, version 3.0 and analysed using SPSS, version 13. At the end of the study period, the distribution of satisfaction was computed for all the 4 phases and the chi-squared test was used as a test of significance. Cross-tabulations were carried out between independent variables (age, sex, education, occupation, income, outdoor services used) and the level of satisfaction, the dependent variable.
Staff interventions
Better understanding of consumer needs and more effective responses was the prime focus of the interventions with staff. The quarterly results of the survey helped in designing the workshops for capacity-building and sensitization of the hospital staff and managers to bring about a positive change. Each phase of data collection was followed by a specially designed workshop for the management staff and the health personnel of the facility. The results of each phase were shared with the facility staff in order to sensitize them to the issue of patient satisfaction. Themes and focus of the workshops were suggested by the staff themselves. The project team then developed the sessions accordingly.
Intervention I: Concepts of quality in health care. The baseline data collection or 1st phase was followed by the 1st workshop on the concepts of quality of care in health. The objectives covered in this workshop were: defining the notion of quality of care; quality of care and its significance in health care; and its relationship with patient satisfaction.
Intervention II: Counselling skills and interpersonal communication. The 2nd phase was followed by the 2nd workshop on counselling skills and interpersonal communication. The objectives were: importance of counselling and interpersonal communication; types of counselling; skills and principles of counselling. Role-plays were also included to enhance the understanding of the concepts.
Intervention III: Gender and health. The 3rd workshop focused on gender-related issues in health. The objectives were patient’s perspectives of quality of care; understanding gender-specific issues and the needs of their clients especially women; and the importance of behaviour and attitude change.
Results
Sociodemographic details
The age breakdown of the patients showed that 31% were aged < 25 years, 38% were
25–34 years, 23% were 35–49 years and 8% were > 50 years. The majority of the patients were women (85%). As for literacy levels, 56% were illiterate, 10% could just read and write or had some informal religious education, 24% had 5–8 years of schooling and 10% were educated until 10th grade. The majority of the clients were housewives (70%), 20% were involved in agricultural labour or daily wage work, and 10% were either in service or were skilled labourers having their own business. The median monthly income of the patients was around rupees (Rs) 3500 (US$ 58) per month, interquartile range Rs 2500–6000 (US$ 42–100) per month.
Satisfaction trends
Of the patients, 60% came to the health facility for a consultation to the general outpatient service whereas 40% came for a gynaecological consultation. The level of satisfaction of the patients with regards to the health services provided in the facility showed a gradual increase over a period of 1 year in 4 phases. The baseline satisfaction level of 34.4% rose to 82.0% after the 4th round of data collection (Table 1).
Cross-tabulations
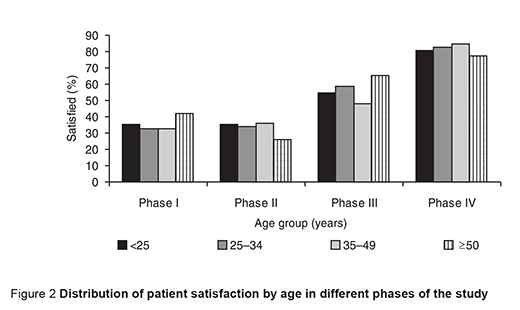
For age, trends showed a gradual increase in satisfaction in all age groups of patients, which was more pronounced in the reproductive age group (Figure 2). An analysis by sex was not done as the respondents were predominantly women due to the fact that survey was conducted during daytime.

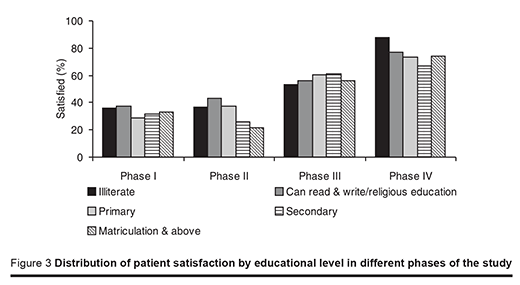
Analysing the satisfaction level in various groups with different education status, it was observed that satisfaction levels improved more among the illiterate patients as compared to the other groups (Figure 3).

The majority of our respondents were housewives, and the satisfaction level of this group fluctuated during different phases
(between 60%–70%). This was attributed to changes in the staffing due to the turnover of staff members—women doctors were available in the facility at one time and not later on—which led to dissatisfaction among the patients. Cessation of the some of the antenatal services for logistic reasons was one of the causes of dissatisfaction at one stage.
The other groups, including day labourers, agricultural labourers, government or private sector employees, students and businessmen, however, showed an increase in satisfaction level over the study period (> 75% in the last phase).
When the services visited were crossanalysed, it was observed that generally the level of satisfaction for both the outpatient departments improved except in phase 2, when an experienced woman doctor left and a new doctor was recruited.
Chi-squared, 1-way ANOVA and Kruskal–Wallis tests were applied to all independent variables to study their effect on the overall level of satisfaction of the patients. No significant effect of age (P = 0.233), education (P = 0.282), occupation (P = 0.140) and income (P = 0.368) was observed; whereas sex (P < 0.001) and service used (P < 0.001) had a significant effect on the level of satisfaction.
Discussion
Patient satisfaction surveys are being increasingly conducted globally to study patient views on a number of matters such as information needs, interpersonal and organizational aspects of care and value of medical treatment [19–22]. The users express their satisfaction with some of the components of health care as compared to others; therefore these viewpoints ought to be considered by health planners and health service researchers to work out various strategies and solutions to improve patient satisfaction [23]. Patient satisfaction is well recognized now because of the influence of perceived quality over demand [24]. The role of the health centres that provide health services needs to be addressed through the people’s own experiences as it influences their satisfaction with the care, improves quality of service and in turn its utilization [25,26]. The providers must get firsthand information from their clients which should help them to reorient their services by adopting a more client-centred approach, transforming their attitude and introducing a convivial ambiance at health service outlets based on the feedback of their clients [27]. They also need to be more compassionate and caring to the needs of the people they serve [28].
A periodic assessment of patient satisfaction can sensitize the management of a health care facility and health providers to the needs of their patients. In our study, a great deal of change in the attitudes and behaviours of the staff members of the hospital was observed, which was then reflected in an improved level of satisfaction of the patients visiting the outpatient departments of the facility. In fact, the whole process of data collection, sharing the results with the staff of the hospital, brainstorming on the issues and gaps identified and conducting a capacity-building workshop at the end of each phase helped to sensitize the management as well as individual staff members of the hospital.
In the workshops, the constraints and gaps in communication between clients and health care providers were identified, as were differences in the perceptions of clients and providers. The difficulties on the part of the health providers in dealing with the clients were examined. In an atmosphere of consensus, solutions to all the problems were discussed. The concepts of quality services and patient satisfaction were explained and discussed in depth with the staff of the health facility, hence enhancing their understanding of these issues. We deduced subjectively that the staff appreciated the concept of patients’ rights and autonomy while inside the facility. Besides the workshops designed by the study team, the efforts put in by the facility staff were commendable. This was eventually reflected in their dealings with the patients and the results showed great improvement in the satisfaction level of the patients coming to the hospital.
Conclusion
Although this 1-year intervention to periodically gauge the satisfaction level showed an increased level of patient satisfaction, the challenge is to sustain, and further improve, this level in the service. It can be concluded that this particular instrument or these kinds of periodic exercises can help identify gaps in the service with regard to quality of care and thus give an indication of the performance of the health care system.
Acknowledgements
We are extremely thankful to the staff of the hospital and management of the Health And Nutrition Development Society (HANDS) especially Dr Khalid Pervez for courteously facilitating us during the study period. We are grateful for the cooperation of all the participants, the patients who spared their time and shared their views with us.
We are also grateful to the World Health Organization Regional Office for the Eastern Mediterranean for providing funding for the study.
References
- Definitions of quality in healthcare. In: Brown JA, ed. The healthcare quality handbook: a professional resource and study guide, 17th ed. Pasadena, California, JB Quality Solutions Inc., 2002.
- Terms, concepts, principles. In: Bauer JE, Duffy GL, Westcott RT, eds. The quality improvement handbook. Milwaukee, ASQ Quality Press, 2002.
- Creel CL, Perry JR. Improving the quality of reproductive health care for young people. Washington DC, Population Council and Population Reference Bureau, 2003 (New Perspectives on Quality of Care No. 4).
- Savage R, Armstrong D. Effect of a general practitioner’s consulting style on patients’ satisfaction: a controlled study. British medical journal, 1990, 301:968– 70.
- Campbell SM, Roland MO, Buetow SA. Defining quality of care. Social science & medicine, 2000, 51:1611–25.
- World health report 2000. Health systems: improving performance. Geneva, World Health Organization, 2000.
- Garner P, Thomason J, Donaldson D. Quality assessment of health facilities in rural Papua New Guinea. Health policy and planning, 1990, 5:49–59.
- Nicholas DD, Heiby JR, Hatzell TA. The quality assurance projects: introducing quality improvement to primary health care in less developed countries. Quality assurance in health care, 1991, 3:147– 65.
- Margolis SA et al. Patient satisfaction with primary health care services in the United Arab Emirates. International journal of quality in health care, 2003, 15(3):241–9.
- Haddad S et al. Patient perception of quality following a visit to a doctor in a primary care unit. Family practice, 2000, 17:21–9.
- Aharony L, Strasser S. Patient satisfaction: what we know about and what we still need to explore. Medical care review, 1993, 50:49–79.
- Davies AR, Ware JE Jr. Involving consumers in quality of care assessment. Health affairs, 1988, 7:33–48.
- Goldman RL. The reliability of peer assessment of quality of care. Journal of the American Medical Association, 1992, 267:958–60.
- Calnan M. Towards a conceptual framework of lay evaluation of health care. Social science & medicine, 1988, 27:927– 33.
- Davies AR, Ware JE, Brook RH. Consumer acceptance of prepaid and fee for service medical care: results from a randomized controlled trial. Health services research, 1986, 21:429–52.
- DiMatteo MR, Hays R. The significance of patients’ perceptions of physician conduct: a study of patient satisfaction in a family practice center. Journal of community health, 1980, 6:18–34.
- Pakistan Medical Research Council. Patterns of health care utilization. Islamabad, National Health Survey of Pakistan, 1998.
- Parasuraman A, Zeithaml VA, Berry LL. SERVQUAL: a multi-item scale for measuring consumer perceptions of service quality. Journal of retailing, 1988, 64(1):12–40.
- Wensing M, Elwyn G. Research on patients’ views in the evaluation and improvement of quality of care. Quality and safety in health care, 2002, 11:153–7.
- Ray F. Surveys of patient satisfaction: important general considerations. British medical journal, 1991, 302:887–9.
- Roghmann K, Hengst A, Zastowny T. Satisfaction with medical treatment: its measurement and relation to utilization. Medical care, 1997, 17:461–77.
- Weiss B, Senf J. Patient satisfaction survey instrument for use in health maintenance organizations. Medical care, 1990, 28:434–45.
- Hall JA, Dornan MC. What patients like about their medical care and how often they are asked: A meta-analysis of the satisfaction literature. Social science & medicine, 1988, 27(9):935–9.
- McPake B. User charges for health services in developing countries: a review of the economic literature. Social science & medicine, 1993, 36:1397–405.
- Gilson L, Alilio M, Heggenhougen K. Community satisfaction with primary health care services: An evaluation undertaken in the Morogoro region of Tanzania. Social science & medicine, 1994, 39(6):767–80.
- Lawthers AG et al. Using patient surveys to measure the quality of outpatient care in Krakow, Poland. International journal of quality in health care, 1999, 11(6):497– 506.
- Shaikh BT. Quality of health care: an absolute necessity for patient satisfaction. Journal of the Pakistan Medical Association, 2005, 55(11):515–6.
- Soar Filho EJ. A interacao medico-cliente [The client–doctor interaction]. Revista da Associacao Medica Brasileira, 1998, 44(1):35–42.


