Sociodemographic data
- Total population (in millions) : 11.4
- Maternal mortality per 100 000 live births :62
- Life expectancy at birth (years) : 75
- Total fertility rate (births per woman) : 2.2
- GNI per capita, PPP (current international US$) :11 100
- Health expenditure, total (% of GDP) : 7.0
- Health expenditure per capita (current US$) : 305
- Human Development Index Value :0.73
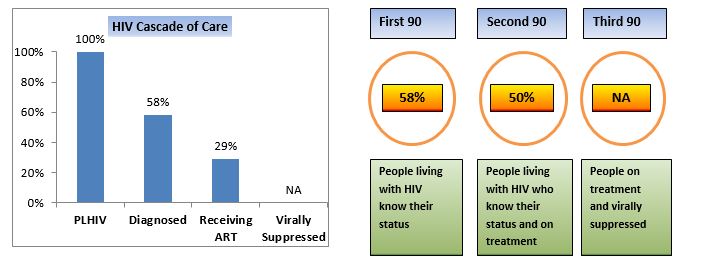
HIV care cascade and progress towards 90-90-90

Epidemiological data (2016)
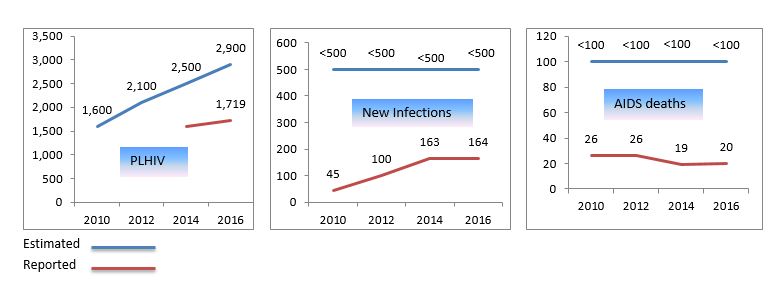
HIV estimates and case notification
|
|
|
HIV in specific populations
|
|
Survey data |
|
Size estimate |
Routine testing and VCT data |
|
|
Key populations |
|
|
|
No tested |
HIV+ cases (%) |
|
Sex Workers (SW) |
0.9% (2014) (TLS) |
|
|
84 |
.04% |
|
Men having Sex with Men (MSM) |
9.1% (2014) (TLS) |
|
|
175 |
.5% |
|
People who inject drugs (PWIDs) |
2.7% (2011) (RDS) |
|
|
190 |
3.6% |
|
Prisoners |
|
|
|
1,439 (2015) |
0.1% |
|
Populations in health settings |
|
|
|
|
|
|
TB patients |
|
|
|
2560(2015) |
0% |
|
Pregnant women |
|
|
|
11,294 |
0% |
|
Blood Donors |
|
|
|
206,740 |
.02% |
|
Clients of testing services |
|
|
|
|
|
Response
Policy implementation
|
|
|
|
|
|
Treatment initiation threshold adults and adolescents |
|
≤500 CD4 cells/mm3 |
|
|
Implementation of Treat All adults and adolescents |
|
Data not reported |
|
|
Treatment initiation threshold children |
|
Treat All, with an age cut-off <1 year |
|
|
Implementation of lifelong ART to pregnant & breastfeeding women |
Implemented in a small number (<50%) of MCH sites |
||
|
Implementation of national policy on viral load monitoring |
|
Fully implemented |
|
HIV testing coverage in key populations *
Data not available
Antiretroviral therapy and PMTCT coverage
References
(1) http://www.prb.org/pdf16/prb-wpds2016-web-2016.pdf; (2) WHO.EMRO Regional Surveillance Data; (3) UNAIDS/WHO estimates 2016; (4) Global AIDS Monitoring (GAM) 2016.


